
Every BDC record
Dividend coverage, bad loans, debt and fees for each of the 40+ BDCs, quarter by quarter.
Every business development company with an open record page, read from the live product. Coverage is net investment income over the regular dividend across the last four reported quarters. Prices are 15 minutes delayed and refresh every hour.
| Ticker | Company | Price | Yield | NAV | NII coverage | Pays | IQS | More columns |
|---|---|---|---|---|---|---|---|---|
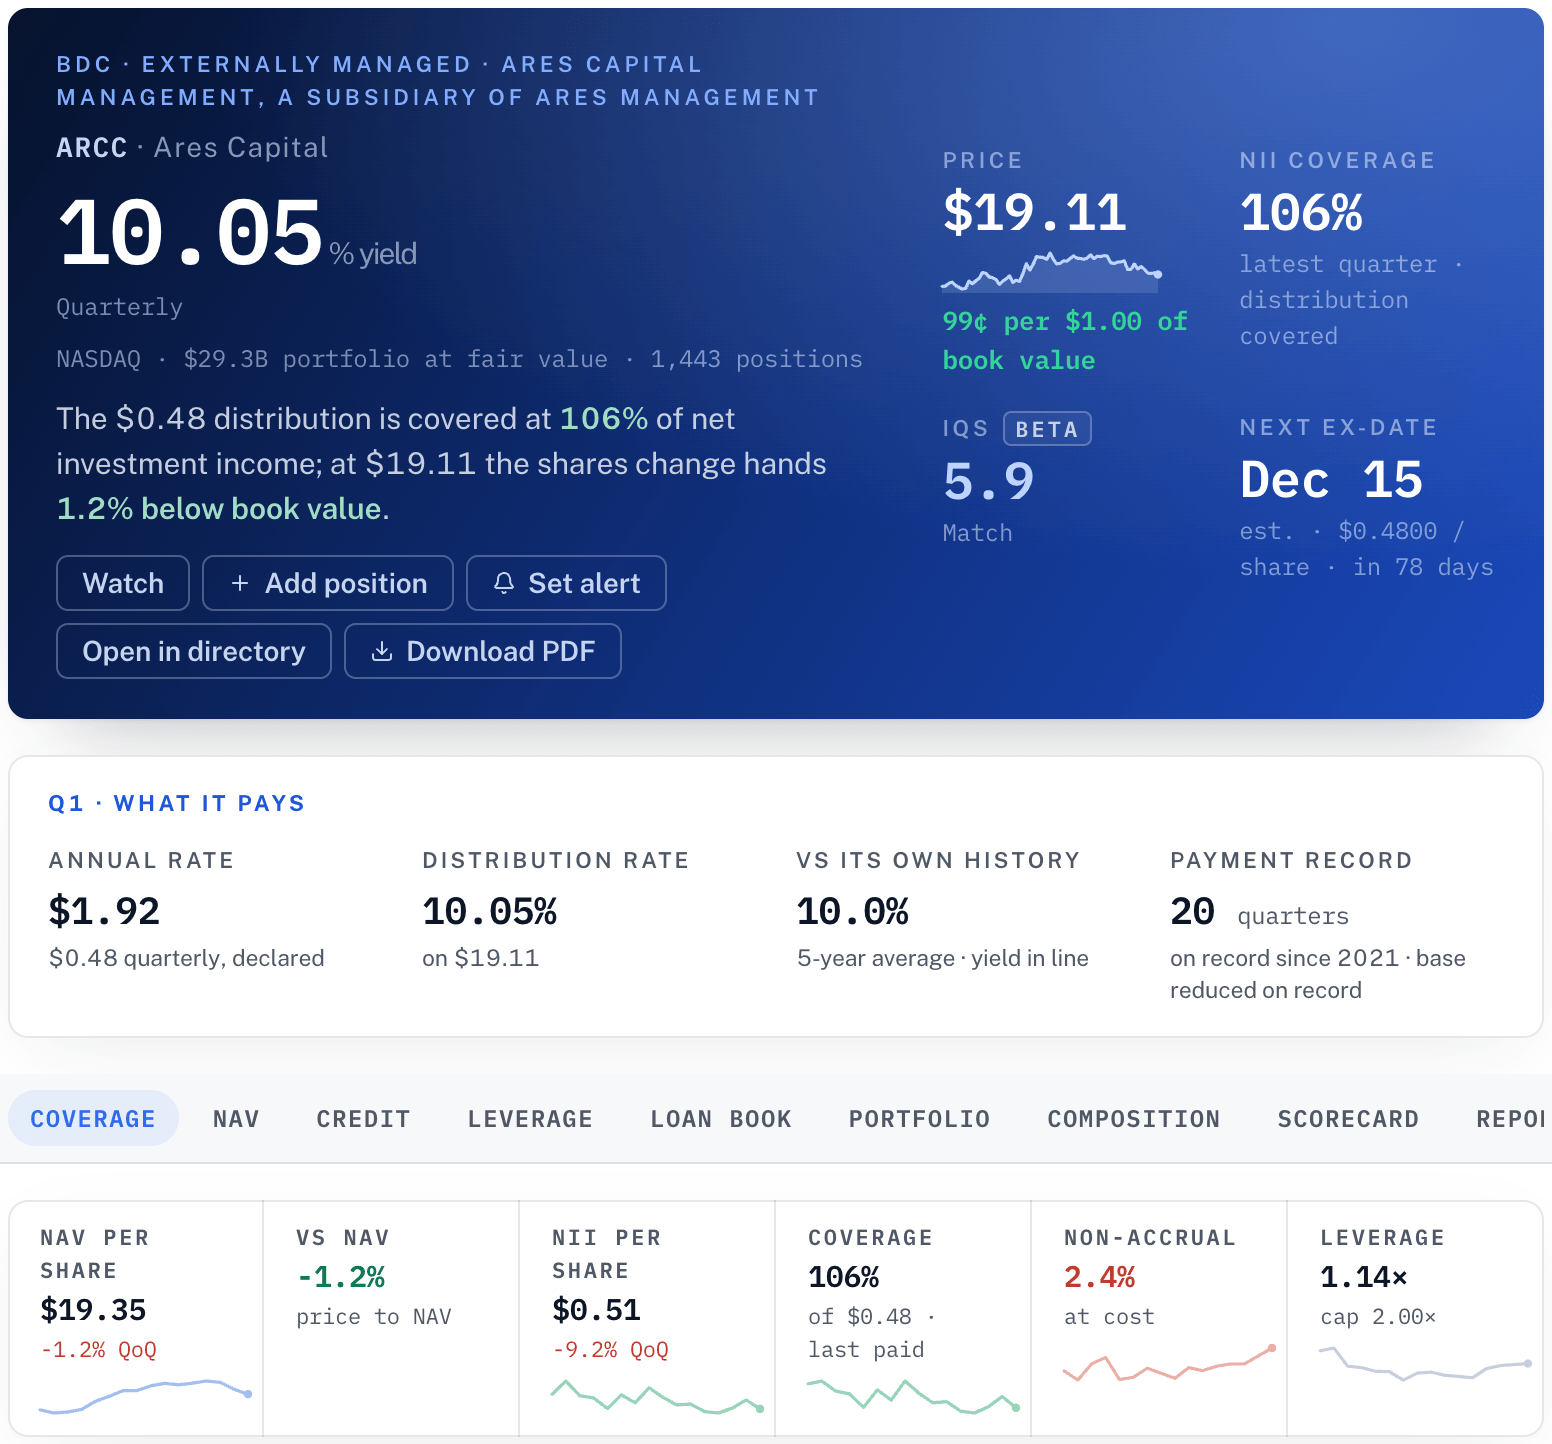
| ARCC | Ares Capital | $19.13 | 10.04% | $19.31 | 1.07x | Quarterly | 5.8Average | P/NAV, non-accruals, leverage, credit |
| MAIN | Main Street Capital | $57.01 | 5.58% | $33.92 | 1.23x | Monthly | 8.8High Quality | P/NAV, non-accruals, leverage, credit |
| OBDC | Blue Owl Capital Corporation | $10.94 | 11.33% | $14.26 | 1.15x | Quarterly | 5.1Average | P/NAV, non-accruals, leverage, credit |
| GBDC | Golub Capital BDC | $12.74 | 10.36% | $14.25 | 1.06x | Quarterly | 4.6Watch | P/NAV, non-accruals, leverage, credit |
| HTGC | Hercules Capital | $16.16 | 9.90% | $12.26 | 1.19x | Quarterly | 8.2High Quality | P/NAV, non-accruals, leverage, credit |
| FSK | FS KKR Capital Corp | $11.70 | 15.04% | $18.30 | 1.03x | Quarterly | 2.1Watch | P/NAV, non-accruals, leverage, credit |
| TSLX | Sixth Street Specialty Lending | $17.65 | 9.52% | $16.24 | 1.10x | Quarterly | 5.2Average | P/NAV, non-accruals, leverage, credit |
| TRIN | Trinity Capital | $17.80 | 11.46% | $13.47 | 1.02x | Monthly | 7.0Good | P/NAV, non-accruals, leverage, credit |
| CSWC | Capital Southwest | $23.26 | 9.98% | $16.61 | 0.97x | Monthly | 7.4Good | P/NAV, non-accruals, leverage, credit |
| MSDL | Morgan Stanley Direct Lending Fund | $13.62 | 13.22% | $19.50 | 1.09x | Quarterly | 5.4Average | P/NAV, non-accruals, leverage, credit |
A business development company lends to private, mid-sized companies and passes most of what it earns to shareholders as dividends. The yield is the regular dividend as a percent of today’s price; specials are left out so that one quarter’s extra does not flatter the figure.
NAV is net asset value a share, the loans and other holdings less the debt, as the company reported it for the quarter named on its record. A price above NAV is a premium, below it a discount. NII coverage is net investment income, the interest and fees earned less the costs of running the company, divided by the regular dividend, over the last four reported quarters. At 1.00x the dividend was exactly earned; above it, earned with room to spare; below it, paid in part from income carried over from earlier quarters.
Coverage counts interest the company booked but did not yet receive in cash, called payment in kind. The record shows how much of the income was PIK and how many loans are on non-accrual, which is where coverage changes next.
Coverage for every BDC, not only the open records, quarter by quarter, is on the coverage page. Price to NAV, the non-accrual share, leverage, the fee terms and the quarter-by-quarter ledger are on each record. All 40+ BDCs, with filters, saved screens, the research reports and the alerts, open with an account: the first 10 rows of each screener on Starter, every row on Plus.
The score describes income quality on a 0-to-10 scale and ranks nothing. Credit quality shows Investment grade, High yield or Not rated. Sources: SEC EDGAR, licensed market data, FRED. Nothing on this page is investment advice or a recommendation to buy, sell or hold.
Each page puts two records next to each other, with the payment history of both.
Dividend coverage, bad loans, debt and fees for each of the 40+ BDCs, quarter by quarter.
Up to 10 BDCs on the watchlist. Price targets and declarations, by email, push or in the app.
One email a week with the moves that cleared the quality bar.
Starter shows the first 10 rows of each screener. Plus opens every row, the filters and saved screens.
No card is required. Starter shows the first 10 rows of each screener, one watchlist and 3 alerts. Plus opens every row, with filters and saved screens.