
Every fund record
Distribution yield, payment history and Yield Sustainability, what each fund earned against what it paid, for each of the 150+ funds.
Every option-income fund with an open record page, read from the live product. The distribution rate is the trailing twelve months of payments over today's price. Prices are 15 minutes delayed and refresh every hour.
| Ticker | Fund | Price | Distribution rate | NAV | Expense ratio | Pays | IQS | More columns |
|---|---|---|---|---|---|---|---|---|
| SPYI | Neos S&P 500(R) High Income ETF | $51.29 | 11.90% | $51.11 | 0.68% | Monthly | 7.8Good | Sustainability, return of capital, AUM |
| QQQI | NEOS Nasdaq-100 High Income ETF | $49.48 | 15.38% | $48.88 | 0.68% | Monthly | 6.1Average | Sustainability, return of capital, AUM |
| GPIX | Goldman Sachs S&P 500 Premium Income ETF | $53.36 | 8.74% | $53.17 | 0.29% | Monthly | 8.3High Quality | Sustainability, return of capital, AUM |
| GPIQ | Goldman Sachs Nasdaq-100 Premium Income ETF | $51.26 | 11.04% | $50.56 | 0.29% | Monthly | 8.3High Quality | Sustainability, return of capital, AUM |
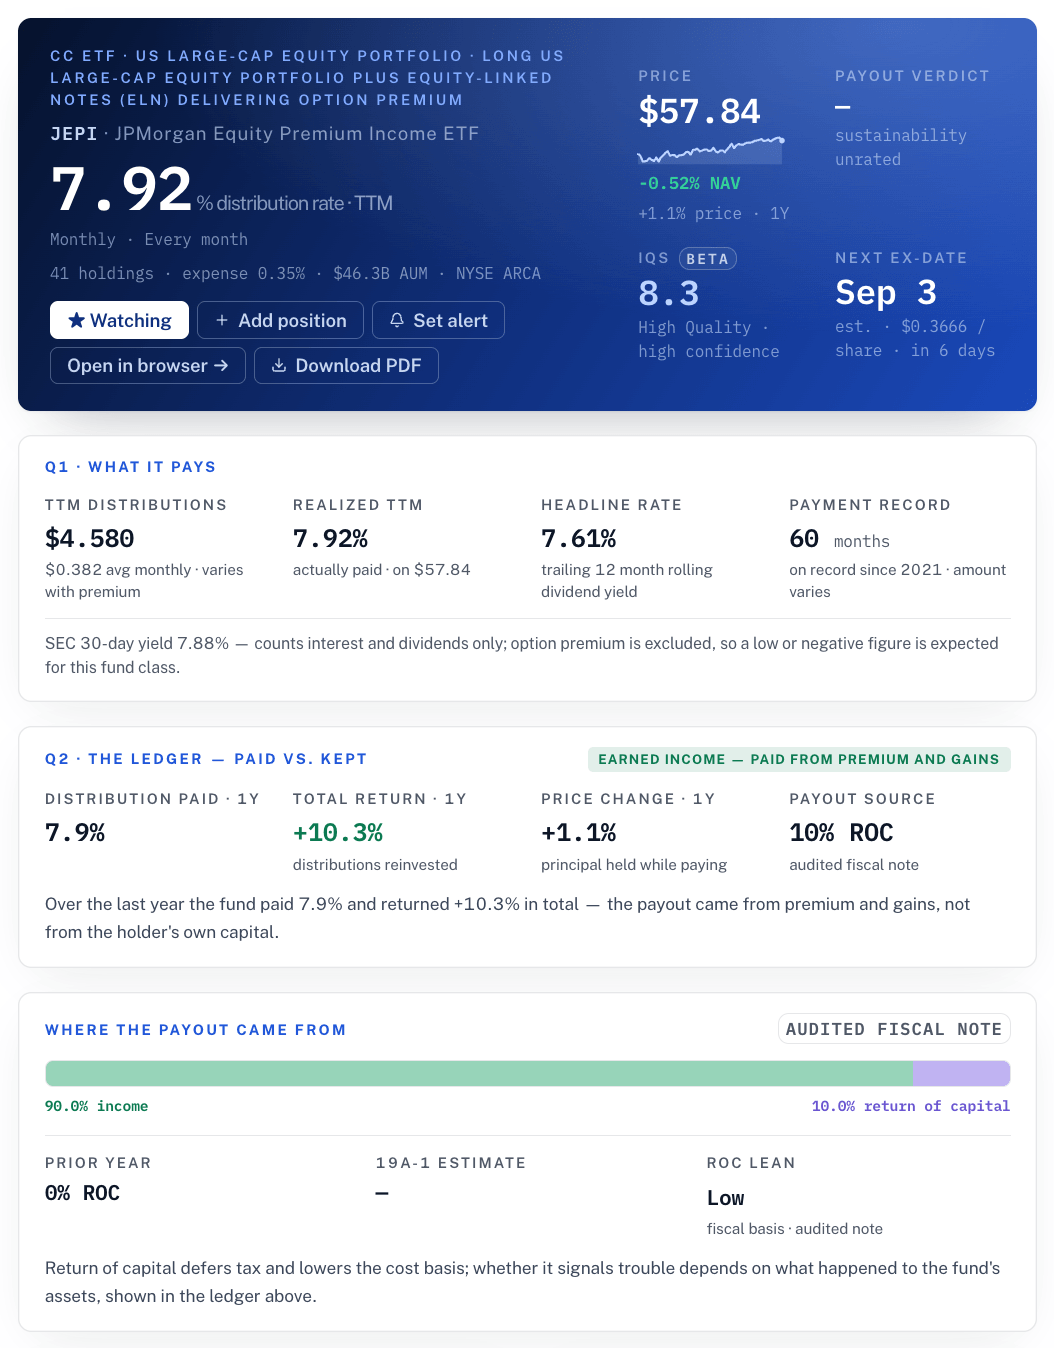
| JEPI | JPMorgan Equity Premium Income ETF | $56.43 | 7.38% | $56.38 | 0.35% | Monthly | 8.3High Quality | Sustainability, return of capital, AUM |
| JEPQ | JPMorgan Nasdaq Equity Premium Income ETF | $54.34 | 11.91% | $53.68 | 0.35% | Monthly | 8.3High Quality | Sustainability, return of capital, AUM |
| QYLD | Global X - Nasdaq 100 Covered Call ETF | $17.11 | 12.81% | $16.88 | 0.60% | Monthly | 9.2High Quality | Sustainability, return of capital, AUM |
| DIVO | Amplify CWP Enhanced Dividend Income ETF | $46.61 | 4.93% | $46.68 | 0.56% | Monthly | 8.1High Quality | Sustainability, return of capital, AUM |
| RDVI | FT Vest Rising Dividend Achievers Target Income ETF | $27.55 | 8.61% | $27.64 | 0.75% | Monthly | 8.7High Quality | Sustainability, return of capital, AUM |
| XYLD | Global X - S&P 500 Covered Call ETF | $40.19 | 9.38% | $40.04 | 0.60% | Monthly | 9.3High Quality | Sustainability, return of capital, AUM |
| CSHI | Neos Enhanced Income Cash Alternative ETF | $49.62 | 5.00% | $49.56 | 0.38% | Monthly | 8.4High Quality | Sustainability, return of capital, AUM |
| IDVO | Amplify CWP International Enhanced Dividend Income ETF | $38.83 | 6.25% | $38.76 | 0.65% | Monthly | 7.0Good | Sustainability, return of capital, AUM |
| NVDY | YieldMax NVDA Option Income Strategy ETF | $10.22 | 34.04% | $9.92 | 1.09% | Weekly | 4.3Watch | Sustainability, return of capital, AUM |
| BTCI | NEOS Bitcoin High Income ETF | $30.15 | 27.68% | $32.29 | 0.99% | Monthly | 3.4Watch | Sustainability, return of capital, AUM |
| IWMI | NEOS Russell 2000 High Income ETF | $48.04 | 14.31% | $47.64 | 0.68% | Monthly | 8.2High Quality | Sustainability, return of capital, AUM |
| ISPY | ProShares - S&P 500 High Income ETF | $46.00 | 6.19% | $45.70 | 0.55% | Monthly | 7.5Good | Sustainability, return of capital, AUM |
| MSTY | YieldMax MSTR Option Income Strategy ETF | $12.68 | 64.14% | $12.69 | 1.03% | Weekly | 1.8Watch | Sustainability, return of capital, AUM |
| MLPI | NEOS MLP & Energy Infrastructure High Income ETF | $49.28 | 14.67% | $49.30 | 0.68% | Monthly | 6.0Average | Sustainability, return of capital, AUM |
| QDVO | Amplify CWP Growth & Income ETF | $27.38 | 11.87% | $27.17 | 0.56% | Monthly | 5.3Average | Sustainability, return of capital, AUM |
| ROCY | JPMorgan Equity Premium Yield ETF | $53.02 | 6.81% | $52.80 | 0.35% | Monthly | 5.9Average | Sustainability, return of capital, AUM |
| TSLY | YieldMax TSLA Option Income Strategy ETF | $20.03 | 56.41% | $19.22 | 1.07% | Weekly | 3.0Watch | Sustainability, return of capital, AUM |
| IAUI | NEOS Gold High Income ETF | $46.65 | 12.42% | $46.89 | 0.79% | Monthly | 4.7Watch | Sustainability, return of capital, AUM |
| AMDY | YieldMax AMD Option Income Strategy ETF | $36.09 | 48.43% | $32.30 | 1.00% | Weekly | 5.3Average | Sustainability, return of capital, AUM |
| IQQQ | ProShares - Nasdaq-100 High Income ETF | $43.41 | 6.40% | $42.70 | 0.55% | Monthly | 6.1Average | Sustainability, return of capital, AUM |
| YMAX | YieldMax Universe Fund of Option Income ETFs | $6.64 | 41.35% | $6.54 | 1.33% | Weekly | 4.8Watch | Sustainability, return of capital, AUM |
A covered-call ETF holds stocks or an index and sells call options against them. The option premium it collects is paid out as the distribution, which is why these funds yield more than the stocks they hold. The price of that income is the gain given up when the market rises past the option’s strike.
The distribution rate is the last twelve months of payments divided by today’s price. It is not a promise: each month’s payment is set by the premium the fund collected, and it changes. NAV is the value of the fund’s holdings a share. A fund whose NAV falls while its rate holds is paying part of its own capital out as income, and the rate alone will not show it.
The expense ratio comes out of the fund before anything is distributed. “Pays” is how often the payment arrives; most of these funds pay monthly, some weekly. The score is the Income Quality Score, a 0-to-10 reading of how well the payout is supported by what the fund earns, explained on the methodology page.
The share of each payment that was return of capital, the fund’s Yield Sustainability reading, assets under management and the payment history are on each record. All 150+ funds, with filters, saved screens and the alerts, open with an account: the first 10 rows of each screener on Starter, every row on Plus.
The score describes income quality on a 0-to-10 scale and ranks nothing. Credit quality shows Investment grade, High yield or Not rated. Sources: SEC EDGAR, licensed market data, FRED. Nothing on this page is investment advice or a recommendation to buy, sell or hold.
Each page puts two records next to each other, with the payment history of both.
Distribution yield, payment history and Yield Sustainability, what each fund earned against what it paid, for each of the 150+ funds.
Up to 10 funds on the watchlist, each on the Income Calendar.
One email a week with the moves that cleared the quality bar.
Starter shows the first 10 rows of each screener. Plus opens every row, the filters and saved screens.
No card is required. Starter shows the first 10 rows of each screener, one watchlist and 3 alerts. Plus opens every row, with filters and saved screens.