
Every fund record
Yield, holdings, credit mix and the payment history for each of the 15+ preferred funds.
Every preferred stock fund with an open record page, read from the live product. The yield is the trailing twelve months of payments over today's price. Prices are 15 minutes delayed and refresh every hour.
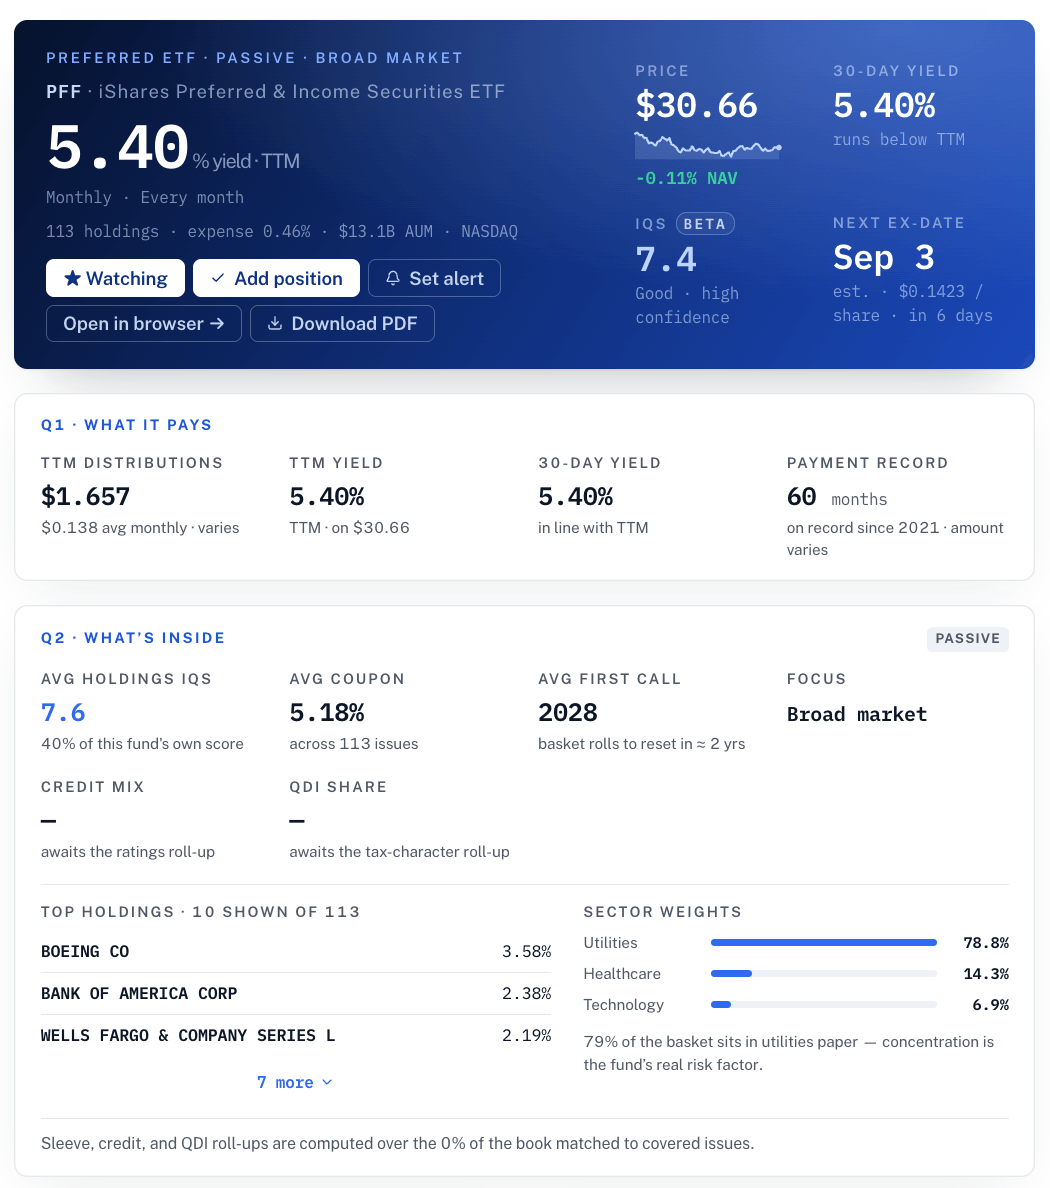
| Ticker | Fund | Price | Yield | NAV | Expense ratio | Pays | IQS | More columns |
|---|---|---|---|---|---|---|---|---|
| PFF | iShares Preferred & Income Securities ETF | $28.26 | 5.79% | $28.22 | 0.45% | Monthly | 8.2High Quality | Holdings, credit mix, average coupon |
| FPE | First Trust Preferred Securities & Income ETF | $17.09 | 6.33% | $17.12 | 0.83% | Monthly | 8.0High Quality | Holdings, credit mix, average coupon |
| PGF | Invesco Financial Preferred ETF | $12.60 | 6.88% | $12.62 | 0.56% | Monthly | 7.8Good | Holdings, credit mix, average coupon |
| PREF | Principal Spectrum Preferred Securities Active ETF | $18.45 | 5.50% | $18.42 | 0.55% | Monthly | 8.7High Quality | Holdings, credit mix, average coupon |
| PFFD | Global X U.S. Preferred ETF | $16.91 | 7.10% | $16.87 | 0.23% | Monthly | 8.4High Quality | Holdings, credit mix, average coupon |
| PFFA | Virtus InfraCap U.S. Preferred Stock ETF | $18.48 | 11.17% | $18.49 | 2.11% | Monthly | 5.0Average | Holdings, credit mix, average coupon |
| PGX | Invesco Preferred ETF | $9.93 | 6.89% | $9.94 | 0.50% | Monthly | 8.6High Quality | Holdings, credit mix, average coupon |
| VRP | Invesco Variable Rate Preferred ETF | $23.70 | 5.91% | $23.71 | 0.50% | Monthly | 8.6High Quality | Holdings, credit mix, average coupon |
| PSK | SPDR ICE Preferred Securities ETF | $28.02 | 7.49% | $28.01 | 0.45% | Monthly | 7.9Good | Holdings, credit mix, average coupon |
| SPFF | Global X SuperIncome Preferred ETF | $8.70 | 7.36% | $8.70 | 0.48% | Monthly | 6.1Average | Holdings, credit mix, average coupon |
A preferred stock ETF holds a basket of preferred shares and passes their dividends through as its own distribution, usually monthly. It trades all day like a stock, so its price moves with the preferreds it holds, which move with interest rates: when rates rise, fixed coupons are worth less and the fund falls.
The yield is the last twelve months of payments divided by today’s price. NAV is the value of the holdings a share; the price and NAV of an ETF stay close, and a gap between them is worth a look. The expense ratio comes out before any distribution is paid, and on a fund that yields six percent a half-point of fee is a twelfth of the income.
Some of these funds follow an index and some are run by a manager who picks the holdings; the record names which. The score is the Income Quality Score, a 0-to-10 reading of the quality of the book the fund holds, explained on the methodology page.
The holdings, the share rated investment grade, the average coupon and call year, and the payment history are on each record. All 15+ funds, with filters and the alerts, open with an account: the first 10 rows of each screener on Starter, every row on Plus.
The score describes income quality on a 0-to-10 scale and ranks nothing. Credit quality shows Investment grade, High yield or Not rated. Sources: SEC EDGAR, licensed market data, FRED. Nothing on this page is investment advice or a recommendation to buy, sell or hold.
Each page puts two records next to each other, with the payment history of both.
Yield, holdings, credit mix and the payment history for each of the 15+ preferred funds.
Up to 10 funds on the watchlist, each on the Income Calendar.
One email a week with the moves that cleared the quality bar.
Starter shows the first 10 rows of each screener. Plus opens every row, the filters and saved screens.
No card is required. Starter shows the first 10 rows of each screener, one watchlist and 3 alerts. Plus opens every row, with filters and saved screens.