
Every record page
The four-question record for each of the 750+ issues, with the score and the payment history.
Every preferred with an open record page, read from the live product. Every row is the number a member sees and every ticker opens its record. Prices are 15 minutes delayed and refresh every hour.
| Ticker | Issuer | Coupon | Price | Current yield | Call date | vs par | Pays | IQS | More columns |
|---|---|---|---|---|---|---|---|---|---|
| C-N | Citigroup Capital XIII | 10.707% | $26.41 | 10.14% | Callable now | +5.64% | Quarterly | 6.1Average | Yield to call, yield to worst, credit |
| WFC-L | Wells Fargo & Company | 7.5% | $1,059.89 | 7.08% | — | +5.99% | Quarterly | 7.3Good | Yield to call, yield to worst, credit |
| BAC-B | Bank of America Corporation | 6.00% | $21.75 | 6.90% | — | -13.00% | Quarterly | 6.8Good | Yield to call, yield to worst, credit |
| MS-E | Morgan Stanley | 7.283% | $24.88 | 7.32% | Callable now | -0.48% | Quarterly | 6.2Average | Yield to call, yield to worst, credit |
| BAC-K | Bank of America Corporation | 5.875% | $21.64 | 6.79% | — | -13.44% | Quarterly | 6.8Good | Yield to call, yield to worst, credit |
| PSA-G | Public Storage | 5.05% | $18.10 | 6.97% | — | -27.60% | Quarterly | 8.9High Quality | Yield to call, yield to worst, credit |
| NLY-F | Annaly Capital Management, Inc | 8.987% | $25.46 | 8.82% | Callable now | +1.84% | Quarterly | 7.6Good | Yield to call, yield to worst, credit |
| T-C | AT&T Inc | 4.75% | $15.60 | 7.61% | — | -37.60% | Quarterly | 7.9Good | Yield to call, yield to worst, credit |
| BEP-A | Brookfield Renewable Partners L.P | 5.25% | $16.85 | 7.79% | Callable now | -32.60% | Quarterly | 7.3Good | Yield to call, yield to worst, credit |
| VNO-L | Vornado Realty Trust | 5.4% | $16.95 | 7.96% | — | -32.20% | Quarterly | 6.2Average | Yield to call, yield to worst, credit |
| GOOGN | Alphabet Inc | 6.25% | $41.86 | 7.47% | — | — | Quarterly | 6.3Average | Yield to call, yield to worst, credit |
| GOOGM | Alphabet Inc | 6.25% | $41.78 | 7.48% | — | — | Quarterly | 6.3Average | Yield to call, yield to worst, credit |
| METAM | Meta | 6.5% | $49.40 | 6.58% | Aug 15, 2029 | -1.20% | — | 5.6Average | Yield to call, yield to worst, credit |
| SATA | Strive, Inc | — | $96.54 | 14.13% | — | -3.46% | Daily | 5.8Average | Yield to call, yield to worst, credit |
| BA-A | Boeing Co | 6.00% | $54.93 | 5.46% | — | — | Quarterly | 5.3Average | Yield to call, yield to worst, credit |
| SATS | Strive, Inc | 15.00% | $94.27 | 17.59% | — | -5.73% | Daily | 6.1Average | Yield to call, yield to worst, credit |
| SMCIP | Super Micro Computer, Inc | 7.00% | $50.16 | 6.98% | — | — | Quarterly | 5.1Average | Yield to call, yield to worst, credit |
| SOMN | The Southern Company | 7.13% | $48.26 | 7.38% | — | +93.04% | Quarterly | 6.9Good | Yield to call, yield to worst, credit |
| ORCL-D | Oracle Corporation | 6.5% | $38.08 | 8.53% | — | — | Quarterly | 6.1Average | Yield to call, yield to worst, credit |
| HPE-C | Hewlett Packard Enterprise Co | 7.625% | $114.98 | 3.32% | — | — | Quarterly | 5.5Average | Yield to call, yield to worst, credit |
| BAC-L | Bank of America Corporation | 7.25% | $1,144.05 | 6.34% | — | +14.40% | Quarterly | 7.1Good | Yield to call, yield to worst, credit |
| ALB-A | Albemarle Corporation | 7.25% | $43.84 | 8.27% | — | — | Quarterly | 5.2Average | Yield to call, yield to worst, credit |
| JPM-C | JPMorgan Chase & Co | 6.00% | $22.95 | 6.54% | — | -8.20% | Quarterly | 6.9Good | Yield to call, yield to worst, credit |
| ARES-B | Ares Management Corp | 6.75% | $42.87 | 7.87% | — | — | Quarterly | 5.3Average | Yield to call, yield to worst, credit |
| WFC-Z | Wells Fargo & Company | 4.75% | $16.90 | 7.03% | — | -32.40% | Quarterly | 6.7Good | Yield to call, yield to worst, credit |
| STRK | Strategy Inc | 8.00% | $67.85 | 11.79% | — | -32.15% | Quarterly | 4.5Watch | Yield to call, yield to worst, credit |
| STRD | Strategy Inc | 10.00% | $70.33 | 14.22% | — | -29.67% | Quarterly | 3.6Watch | Yield to call, yield to worst, credit |
| JPM-M | JPMorgan Chase & Co | 4.2% | $15.92 | 6.60% | — | -36.32% | Quarterly | 6.3Average | Yield to call, yield to worst, credit |
| CMSC | CMS Energy Corporation | 5.875% | $20.05 | 7.33% | Callable now | -19.80% | Quarterly | 7.1Good | Yield to call, yield to worst, credit |
| STRF | Strategy Inc | 10.00% | $103.20 | 9.69% | — | +3.20% | Quarterly | 4.5Watch | Yield to call, yield to worst, credit |
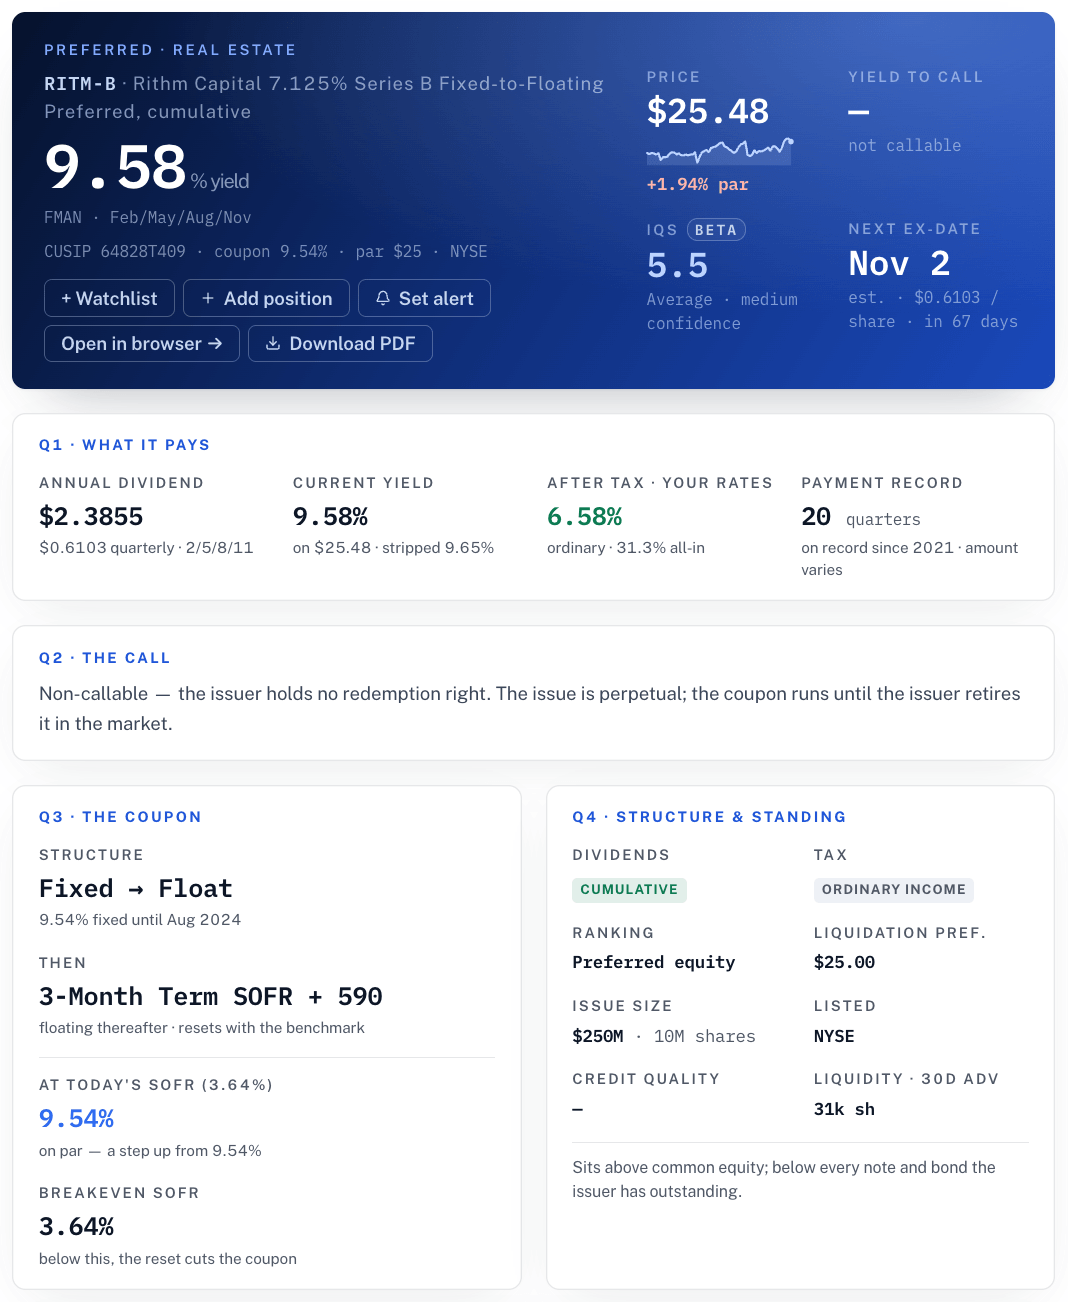
A preferred stock pays a fixed dividend on a fixed par value, usually $25 a share, and trades on an exchange like a stock. The coupon is the dividend as a percent of par. The current yield is the same dividend as a percent of today’s price, so it rises as the price falls and falls as the price rises.
The call date is the first day the issuer may buy the shares back at par. Before it, the holder is owed the dividend; after it, the issuer may end the security on any payment date. “vs par” is where the price sits against $25. Above par, a call returns less than the price paid, so the yield to call on the record is the one to read. Below par, a call pays more than the price, and the current yield understates the return.
“Pays” is how often the dividend arrives. The score is the Income Quality Score, a 0-to-10 reading of how well the payment is supported, explained on the methodology page. It describes; it does not rank.
Yield to call, yield to worst, whether the dividend is cumulative, the credit quality and the fixed-to-floating terms are on each record. The full 750+ issues, with filters by coupon, call date, sector and rating, saved screens and the alerts, open with an account: the first 10 rows of each screener on Starter, every row on Plus.
The score describes income quality on a 0-to-10 scale and ranks nothing. Credit quality shows Investment grade, High yield or Not rated. Sources: SEC EDGAR, licensed market data, FRED. Nothing on this page is investment advice or a recommendation to buy, sell or hold.
Each page puts two records next to each other, with the payment history of both.
The four-question record for each of the 750+ issues, with the score and the payment history.
Up to 10 issues on the watchlist. Price targets and declarations, by email, push or in the app.
One email a week with the moves that cleared the quality bar.
Starter shows the first 10 rows of each screener. Plus opens every row, the filters and saved screens.
No card is required. Starter shows the first 10 rows of each screener, one watchlist and 3 alerts. Plus opens every row, with filters and saved screens.