Best Tools to Check BDC Dividend Safety Before You Buy (2026)
Compare the best tools to check BDC dividend safety, plus five filing checks: NII coverage, PIK income, non-accruals, NAV and leverage.
YieldDesk9 min readPublished

How to test BDC dividend safety yourself
Comparison of tools
1. YieldDesk
2. Simply Safe Dividends
3. Dividend.com
4. Seeking Alpha
5. Stock Simplifier
6. SEC EDGAR filings
How to combine them
FAQ
Conclusion
Last updated: 14 November 2026. Disclosure: YieldDesk is the publisher's own product and is listed first below. The entries for other tools describe what we found in our research and may be incomplete, so check each vendor's page for current details.
The best tools to check BDC dividend safety are the ones that let you test whether net investment income covers the regular dividend. SEC EDGAR filings are the primary free source. YieldDesk and Simply Safe Dividends add scoring and research on top, and Dividend.com, Seeking Alpha and Stock Simplifier work as secondary checks. No tool can guarantee a dividend, so treat every score as a starting point for reading the filing.
How to test BDC dividend safety yourself
A business development company, or BDC, is a listed lender to private middle-market businesses. Because it is taxed as a regulated investment company, it pays out most of its income as dividends. That makes the dividend only as safe as the income behind it. Five checks, all found in the 10-Q or 10-K, do most of the work.
NII coverage. Net investment income, or NII, is what a BDC earns from interest and fees after expenses, before gains and losses on the portfolio. NII coverage is NII per share divided by the regular dividend per share. A reading above 1.0x means the dividend was earned. A reading below 1.0x means the BDC paid out more than it earned, and the gap has to come from spillover income, NAV or new capital. Use regular dividends only. Supplemental and special dividends can distort the ratio.
Payment-in-kind (PIK) income share. PIK income is interest that borrowers add to their loan balance instead of paying in cash. It counts toward NII but brings in no cash. A rising PIK share means more of the reported income is not cash, so track it as a share of total investment income across several quarters.
Non-accruals. A loan on non-accrual has stopped producing interest income. The filing reports non-accruals at cost and at fair value as a percentage of the portfolio. A climbing figure signals that future NII is under pressure.
NAV per share trend. Net asset value, or NAV, per share is the book value of each share. A dividend covered by NII can still be a poor deal if NAV per share is falling, because credit losses are eroding the capital that earns the income. Check NAV over at least four to eight quarters, not one.
Spillover income and leverage. Spillover income is taxable income retained from prior years and not yet distributed. It lets a BDC pay a dividend that current earnings do not fully cover, but it is finite. Leverage, usually shown as debt to equity, matters because a more leveraged BDC has less room to absorb losses before it hits its asset coverage limit.
Run the checks together. Coverage above 1.0x alongside rising PIK, rising non-accruals and a falling NAV is a weaker picture than the headline ratio suggests. The tools below differ mainly in how much of this work they do for you.
Comparison of tools
Tool | Best for | Price | BDC depth |
|---|---|---|---|
YieldDesk | Daily scoring and filing alerts across income securities | Free Starter plan; Plus $14.95/month or $149/year; Elite $24.95/month or $249/year | Quarterly research report on every BDC |
Simply Safe Dividends | Dividend safety scores across many stocks | $468/year billed annually | Rates 36 BDCs (per its Nov 9, 2026 page) |
Dividend screening and ratings | Check the vendor page | Not found in our research | |
Seeking Alpha | Analyst articles and community discussion | Check the vendor page | Varies by author; not a standardized check |
Stock Simplifier | Free safety check on individual stocks | Check the vendor page | Not found in our research |
SEC EDGAR | Primary source filings | Free | Complete, but you do the analysis |
Source: vendor pages and YieldDesk research as of November 14, 2026. Prices change; confirm on each vendor's site.
1. YieldDesk
YieldDesk covers more than 950 securities across preferred stocks, preferred ETFs, covered-call ETFs and BDCs. Each security gets a daily Income Quality Score. The score is a research score built on a published methodology at yielddesk.co/methodology. It does not predict dividend cuts and does not guarantee safety.
For BDCs, YieldDesk publishes a quarterly research report on every BDC it covers. Data comes from SEC EDGAR, a licensed market-data feed delayed by 15 minutes, and FRED. You can screen BDCs, add them to a watchlist or holdings list, and use 21 calculators, including yield and tax calculators.
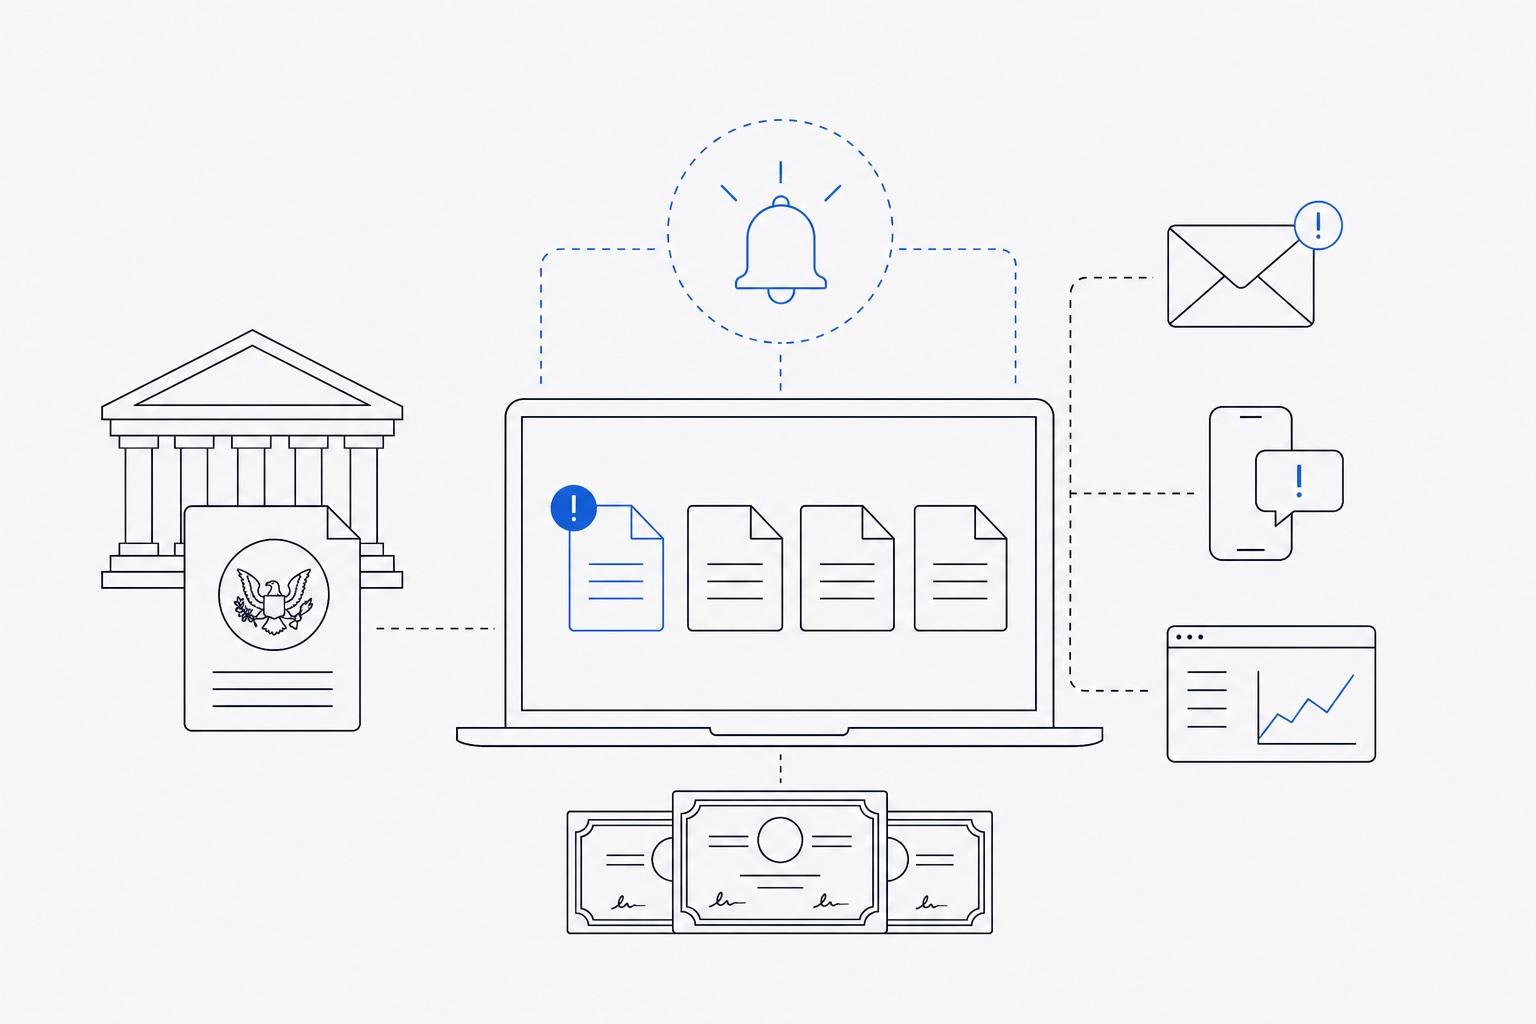
Alerts tell you when a filing may affect a position. They go out the morning after an SEC filing, never instantly. That suits someone who reads filings the next day, not a trader reacting to a release.
Pricing. The Starter plan is free and needs no card. Plus costs $14.95 per month or $149 per year. Elite costs $24.95 per month or $249 per year. Plus and Elite come with a 7-day free trial that requires a card.
Best for: investors who hold BDCs alongside preferreds or covered-call ETFs and want one place to screen, track and read the underlying filings.
Limits: it covers income securities, not the whole stock market. You still need to read the filings behind any score.
2. Simply Safe Dividends
Simply Safe Dividends is a paid dividend-safety service known for its safety scores on dividend stocks. Per its Nov 9, 2026 page, it rates 36 BDCs, a useful range for anyone building a BDC watchlist. It costs $468 per year, billed annually.
Best for: investors who want a dividend-safety score across a broad set of dividend payers, with BDCs as one part of the list.
Limits: annual billing means a larger upfront commitment than the monthly options elsewhere on this list. We did not find evidence in our research of how it treats PIK income share or NAV trend in its BDC ratings, so check its methodology before relying on a score.
3. Dividend.com
Dividend.com is a dividend-focused site with screening tools, ratings and calendars. It works well for finding BDCs by yield and ex-dividend date and for comparing them against other dividend payers.
Best for: quick screening and dividend calendars.
Limits: we did not find BDC-specific safety metrics such as NII coverage, PIK share or non-accruals presented as a standard check. Check the vendor page for current features and pricing.
4. Seeking Alpha
Seeking Alpha publishes articles from independent authors, including many on individual BDCs. A good BDC article walks through NII coverage, non-accruals and NAV trend using the filing numbers, and the comments can raise questions you had not considered.
Best for: reading a thesis and counterarguments on a specific BDC.
Limits: quality and rigor vary by author, and an article is an opinion at a point in time, not a standardized check. Verify any figure against the filing. Check the vendor page for current pricing.
5. Stock Simplifier
Stock Simplifier offers a free safety check on individual stocks. When you have a ticker and want a quick read before going deeper, a free check is a reasonable first look.
Best for: a fast, free first pass on a single name.
Limits: we did not find BDC-specific metrics such as PIK share or non-accruals in our research. Treat it as a screen, then confirm in the filing. Check the vendor page for current details.
6. SEC EDGAR filings
SEC EDGAR is the primary source. Every BDC files a 10-Q each quarter and a 10-K each year. These contain the NII per share, dividends declared, PIK income, non-accruals, NAV per share, spillover income and leverage figures that every other tool on this list draws from.
It is free and complete. The cost is time: you calculate the ratios yourself and compare quarters by hand. For a BDC you are about to buy, reading the most recent 10-Q is worth doing whatever other tool you use. Start with the financial highlights table and the schedule of investments notes, then move to the sections on non-accruals and distributions.
Best for: verifying any score or claim against the source.
How to combine them
A practical order for a BDC you are considering:
Screen with a tool such as YieldDesk or Dividend.com to find candidates and check yield and price.
Check a safety score from YieldDesk or Simply Safe Dividends for a second view.
Read the latest 10-Q on SEC EDGAR and calculate NII coverage yourself, using regular dividends only.
Compare PIK share, non-accruals and NAV per share across at least four quarters.
Read one or two outside analyses, such as Seeking Alpha articles, for arguments you may have missed.
If the tools disagree, the filing decides.
FAQ
What is the best tool to check BDC dividend safety? No single tool covers everything. SEC EDGAR is the primary source, and a scoring service such as YieldDesk or Simply Safe Dividends saves time by organizing the numbers. Confirm any score against the filing.
What NII coverage ratio is safe for a BDC? A reading at or above 1.0x on the regular dividend means the dividend was earned in that quarter. A ratio below 1.0x is not automatically a cut signal, because spillover income can fund the gap. It is a reason to check how much spillover remains.
Does a high PIK share mean the dividend is at risk? Not by itself. PIK income is real income that has not yet been paid in cash. A rising share across several quarters, especially alongside rising non-accruals, means more of NII is not cash and deserves a closer look.
Where do I find a BDC's non-accruals? In the 10-Q or 10-K, in the portfolio and credit quality discussion. Non-accruals are reported at cost and at fair value as a share of the portfolio.
Can a score tell me whether a BDC will cut its dividend? No. A score summarizes available data under a stated method. YieldDesk's Income Quality Score is a research score, and its methodology is published at yielddesk.co/methodology. It is not a forecast or a guarantee.
How often should I recheck a BDC's dividend safety? After each quarterly filing, and after any news about credit problems, a dividend declaration or a change in leverage.
Is there a free way to start? Yes. SEC EDGAR is free, and YieldDesk's Starter plan is free with no card required.
Conclusion
The most reliable way to judge BDC dividend safety is to check NII coverage on the regular dividend, then PIK share, non-accruals, NAV per share trend, spillover income and leverage, all from the filing. Use the tools above to speed up screening and to get a second opinion, and read the 10-Q before you buy.
You can start for free with a YieldDesk account. The Starter plan needs no card. Learn more at yielddesk.co.
This article is research, not investment advice. Figures and plan details change, so verify them on each vendor's site and in the original filings before you act.
Library articles are general information about securities and markets. They are not advice on any security or on whether to buy or sell it. Disclosures
The preferred stocks list shows every public record with its price, coupon, call date and yield.
The preferred stocks listRelated articles
How can I get notified automatically about SEC filings that affect the preferred stocks I own?
YieldDesk · 8 min
Covered Call ETF Guide: Income, Yields, Taxes and Risks
YieldDesk · 11 min
Yield on Cost Calculator: How to Work It Out by Hand
YieldDesk · 7 minOne issue, every Sunday.
Eight blocks of data, one chart, no commentary. Rates, the week's movers, listings and filings across preferred stocks, BDCs and covered-call ETFs.
Free · Sundays · unsubscribe at any time · addresses are never shared